
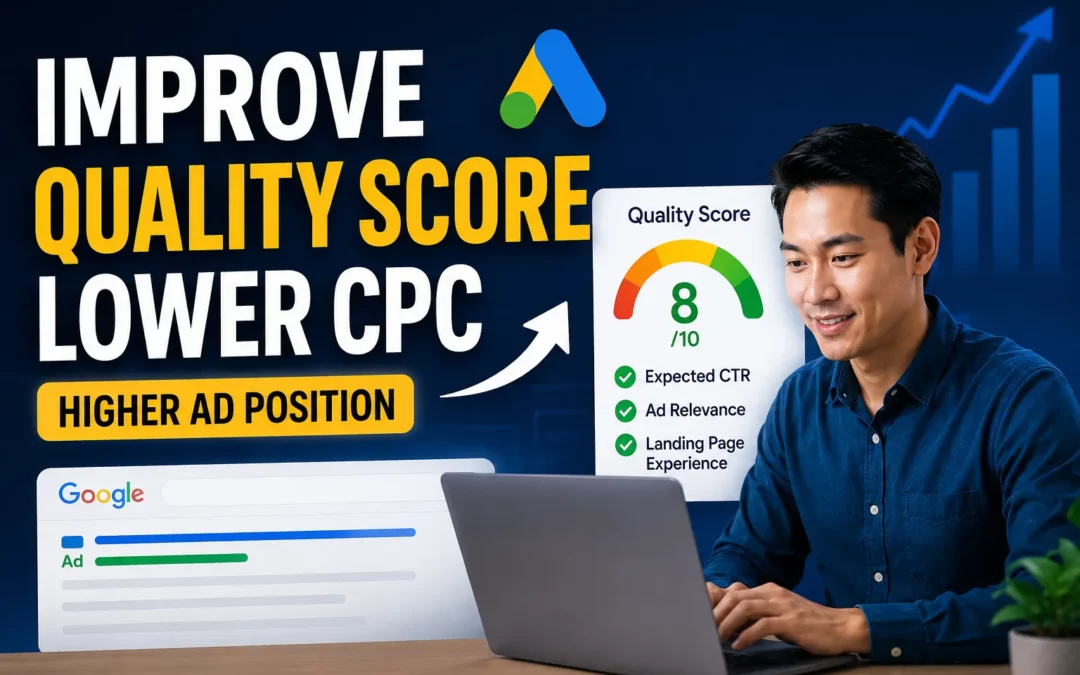
Quality Score is Google’s 1–10 rating that measures how relevant and useful your keyword, ad, and landing page are to the user who triggered the auction. A higher Quality Score directly lowers your cost per click and improves your ad position simultaneously making it the single most powerful lever in all of Google Ads that does not require you to spend more money.
Most beginners treat Quality Score as a vanity metric. In reality, it is a cost multiplier. An advertiser with a Quality Score of 8 can outrank a competitor bidding twice as much, while paying significantly less per click. Therefore, understanding what drives Quality Score and how to systematically improve each component is the foundation of profitable SEM at any budget level. Struggling with low Quality Scores and high CPCs? Our community of SEM practitioners shares real optimization strategies join the conversation here.
What Is Quality Score?
Quality Score is a diagnostic metric in Google Ads that reflects the overall relevance of three interconnected elements: your keyword, your ad copy, and your landing page. Google assigns a score from 1 (lowest) to 10 (highest) at the keyword level, updated as new performance data accumulates.
Quality Score is not the same as Ad Rank, but it is a primary input into the Ad Rank formula. Because Ad Rank determines where your ad appears and what you actually pay per click, Quality Score indirectly controls both your visibility and your campaign economics simultaneously.
Google introduced Quality Score as a mechanism to align advertiser incentives with user experience. By rewarding relevant, high-quality ads with lower costs and better positions, Google ensures that the most helpful ads tend to win auctions not just the most expensive ones.
The Three Components of Quality Score
Quality Score is built from three distinct sub-scores, each rated as “Above Average,” “Average,” or “Below Average.” Understanding each component separately is essential because each requires a different optimization approach.
Component 1: Expected Click-Through Rate (CTR)
Expected CTR measures how likely Google predicts users will click your ad when it appears for a given keyword — based on the historical click-through rate of your ad and keyword combination, adjusted for ad position.
This component answers the question: Does your ad appeal to users who search this keyword?
What drives Expected CTR:
- How closely your ad headlines match the user’s search intent
- How compelling and differentiated your value proposition is
- Whether your ad includes specific, credible details versus generic claims
- The emotional relevance of your offer to the searcher
Status meanings:
- Above Average: Your ad’s predicted CTR exceeds typical performance for this keyword. This component is contributing positively to your Quality Score.
- Average: Your ad performs near the typical CTR for this keyword. Improvement is possible but not urgent.
- Below Average: Your ad is significantly less likely to be clicked than other ads for this keyword. This is actively dragging down your Quality Score and increasing your CPC.
Component 2: Ad Relevance
Ad Relevance measures how closely your ad copy matches the meaning and intent of the keyword being searched. Google evaluates whether your ad directly addresses what the user is looking for when they type that specific query.
This component answers the question: Does your ad actually say what the searcher is looking for?
What drives Ad Relevance:
- Including the keyword or its close variants in your ad headlines
- Ensuring your ad copy speaks to the specific intent signaled by the keyword
- Avoiding generic messaging that could apply to any advertiser in your category
- Organizing keywords into tightly themed ad groups so one ad can be highly relevant to all keywords in the group
Common Ad Relevance mistakes:
- Using one generic ad for 50 different keywords across multiple categories
- Ad groups that mix keywords with different intents (informational vs. transactional)
- Headlines that describe your business in general terms rather than the specific keyword’s intent
The same principle that makes keyword research and intent matching central to SEO applies directly here — aligning your message to the precise intent of each keyword is what separates an Average Ad Relevance from an Above Average one.
Component 3: Landing Page Experience
Landing Page Experience measures how relevant, useful, and user-friendly your landing page is relative to the keyword and ad that brought the user there. Google evaluates this using a combination of automated signals and user behavior data.
This component answers the question: Does your landing page deliver on the promise of your ad?
What Google evaluates on your landing page:
- Relevance of content to the keyword and ad (does the page directly address what was advertised?)
- Page load speed and Core Web Vitals (slow pages score poorly regardless of content quality)
- Mobile-friendliness (Google evaluates mobile experience as the primary standard)
- Transparency (clear information about your business, pricing, and offer)
- Ease of navigation and conversion (can users easily accomplish what the ad promised?)
What hurts Landing Page Experience:
- Sending all paid traffic to your homepage regardless of ad content
- Landing pages that mention the keyword only once at the bottom of the page
- Pages that load in more than 3 seconds on mobile devices
- Confusing navigation, excessive pop-ups, or unclear calls to action
- Significant mismatch between what the ad promised and what the page delivers
Understanding what makes content genuinely useful and SEO-friendly is directly transferable to landing page optimization — because Google evaluates landing pages with many of the same quality signals it applies to organic content. Clarity, relevance, speed, and genuine utility are rewarded in both contexts.
How Quality Score Affects Your CPC and Ad Position
The financial impact of Quality Score is direct and quantifiable. Google’s own data suggests the following CPC adjustments relative to a baseline Quality Score of 5:
| Quality Score | CPC Impact vs. Score of 5 |
|---|---|
| 10 | −50% (pay half as much) |
| 9 | −44% |
| 8 | −37% |
| 7 | −28% |
| 6 | −17% |
| 5 | Baseline (0%) |
| 4 | +25% more |
| 3 | +67% more |
| 2 | +150% more |
| 1 | +400% more |
A Quality Score of 3 means you are paying 67% more per click than an advertiser with a score of 5 targeting the same keyword. A score of 8 means you are paying 37% less. The compounding effect of this over a month of campaigns is significant.
For example, on a $5,000 monthly budget with an average CPC of $3.00 at Quality Score 5 (approximately 1,667 clicks), improving to Quality Score 8 drops your effective CPC to approximately $1.89 generating roughly 2,646 clicks from the same budget, a 58% increase in traffic volume without spending more.
How to Check Your Quality Score in Google Ads
Quality Score is visible at the keyword level in Google Ads. Here is how to access it:
- Log into Google Ads and navigate to your campaign
- Click Keywords in the left navigation
- Add the Quality Score column: click the Columns icon → Modify columns → Quality Score → select Quality Score, Exp. CTR, Ad Relevance, Landing page exp.
- Review each keyword’s overall score and sub-component ratings
Important note: Quality Score is only calculated when a keyword has sufficient data. Newly added keywords or very low-volume keywords may show a dash (—) instead of a score until enough impressions and clicks accumulate.
Google also provides a historical Quality Score view showing how your score has changed over time — useful for confirming that optimization efforts are having the desired effect.
Practical Steps to Improve Each Quality Score Component
Improving Expected CTR
Rewrite headlines to mirror search intent directly. If your keyword is “project management software for small teams,” your Headline 1 should be “Project Management Software for Small Teams” — not “Streamline Your Workflow Today.”
Test multiple headline variations using Responsive Search Ads. Provide 10–15 headline variations that approach the keyword from different angles — feature-focused, benefit-focused, social proof, urgency, question format. Google tests combinations and prioritizes those with the highest CTR.
Study your Search Terms report. The actual queries triggering your ads reveal how users phrase their intent. Use those exact phrases in your ad headlines where possible.
Use specific, credible proof points. “Save 40% on project management costs” outperforms “Save time and money” because it is specific. Specificity signals credibility and improves CTR.
Improving Ad Relevance
Tighten your ad groups. Each ad group should contain only keywords sharing the same core user intent. If your ad group has keywords across multiple distinct themes, split it into separate groups with dedicated ads for each.
Include the keyword in Headline 1. This is the simplest, most reliable way to improve Ad Relevance. When users see their exact search term in your headline, relevance is immediately established.
Use Dynamic Keyword Insertion (DKI) selectively. DKI automatically inserts the triggering keyword into your headline. It works well when all keywords in an ad group are variations of the same intent. It fails when keywords vary widely — producing awkward or irrelevant headlines.
Improving Landing Page Experience
Build dedicated landing pages for each ad group theme. One landing page per major keyword theme is the standard. Sending traffic from 20 different keyword intents to the same homepage guarantees poor Landing Page Experience scores.
Match your landing page headline to your ad headline. Message continuity the seamless flow from ad to landing page is one of the strongest signals of Landing Page Experience quality. Users who click an ad expecting one thing and arrive at something different bounce immediately.
Optimize for mobile speed first. Google evaluates mobile experience as the primary benchmark. Use PageSpeed Insights to identify and fix performance issues. Aim for a Largest Contentful Paint (LCP) under 2.5 seconds on mobile.
Remove navigation distractions. Landing pages convert better and score better when the only clear path is toward the conversion action. Remove header navigation menus from paid landing pages to keep users focused on converting.
Quality Score Myths Worth Addressing
Myth: Quality Score directly determines your position. Quality Score is an input into Ad Rank, not a standalone position ranking. Ad Rank determines position. Quality Score is one of three major factors in Ad Rank.
Myth: A Quality Score of 7 is always achievable. Some keywords — particularly highly competitive generic terms — are structurally difficult to score above 5–6 because expected CTR for the category is inherently lower. Focus on improving score relative to your historical performance rather than chasing a fixed target.
Myth: Pausing a low-Quality Score keyword improves your account’s overall score. Quality Score is calculated at the keyword level. Pausing one keyword does not affect others. However, pausing keywords with very low scores and replacing them with better-targeted alternatives can improve your account’s overall efficiency.
Myth: Higher bids improve Quality Score. Bid amount has no direct relationship with Quality Score. Quality Score is determined entirely by relevance and performance signals not how much you spend.
FAQs
What is a good Quality Score in Google Ads?
A score of 7–10 is considered strong. Scores of 8–10 yield the greatest cost advantages in the auction. A score of 5–6 is average and represents a neutral position — neither a significant advantage nor a major penalty. Scores below 5 indicate relevance or landing page issues actively increasing your costs.
How often does Quality Score update?
Quality Score updates continuously as Google accumulates new performance data. Significant changes to ad copy can affect Expected CTR within days. Landing page changes typically take 1–3 weeks to be fully reflected as Google re-evaluates the page. Historical performance data carries weight, so rapid dramatic improvements are rare.
Does Quality Score affect all campaign types?
Quality Score as a visible metric applies primarily to Search campaigns. Display, Shopping, and Video campaigns have their own quality and relevance systems that influence auction dynamics similarly but are not expressed as a 1–10 Quality Score in the interface.
Can a new account achieve a high Quality Score quickly?
New accounts and new keywords start with limited data. Google assigns a default expected quality based on similar advertisers in the category. Building a strong Quality Score requires accumulating sufficient impressions and clicks — which takes time. New campaigns should focus on structural best practices from day one to build positive performance history quickly.
Does Quality Score affect all keywords equally?
Higher-volume keywords accumulate Quality Score data faster and update more frequently. Very low-volume keywords may show limited or no Quality Score data. The impact of Quality Score on CPC is proportionally the same regardless of volume — but improving quality on high-volume keywords delivers greater absolute cost savings.
How does Quality Score relate to Impression Share?
A low Quality Score can cause ads to fail Google’s minimum threshold for an auction, reducing your Impression Share. When Quality Score is identified as the cause of low Impression Share (as opposed to budget), improving quality is the solution — not increasing bids.
Is Quality Score the same across all match types?
Quality Score is evaluated based on the actual search query, not the match type. The same keyword set to exact match vs. phrase match may accumulate different performance histories if different queries trigger the phrase match version, potentially resulting in different quality assessments over time.
Conclusion
Quality Score is the mechanism Google uses to reward advertisers who genuinely serve their users — and it directly translates that reward into lower costs and better positions. Every point of Quality Score improvement is a compounding financial advantage that reduces what you pay per click while improving where you appear.
The path to a higher Quality Score is not mysterious: write ads that directly address what users search for, organize keywords into tightly themed groups, and build landing pages that deliver exactly what the ad promises. These practices align your advertising with what users actually want which is precisely what Google’s system is designed to measure and reward.
Before your next bid increase, check your Quality Score components. In most cases, fixing a Below Average component delivers more value than spending more. Understanding how SEM works as a full system where Quality Score connects to Ad Rank, CPC, and campaign profitability makes it clear why quality optimization is the highest-leverage activity in paid search. Want an expert review of your Quality Score issues? Share your campaign structure with our community and get actionable feedback join us here.